Defining Your Energy Needs and Goals
The first significant step in putting a solar panel system is identifying your energy demands & expectations. That means you need to compare your electricity usage now to whatever it was last month and the month before and so on. If you want to be 50% carbon neutral and eliminate 50% of your bills, you have to know the total kilowatt-hours (kWh) you use in your home or business per month and then how much energy you must make with solar panels.
Make an energy audit
Provides a complete folder for 12 months of energy tuición. Take an average of these to find your regular power consumption. In California, one unit would be, on average, 600 kWh of electricity used in a month for a single home.
Energy Goals: You need to decide the percentage of your energy that you want to be from renewable sources. For example, the aspiration to supply 70% of your energy from solar is a specific and measurable target.
Projected Energy Savings
Determine your expected energy savings by comparing your current electricity bill with your projected bill after solar panels are installed. Using some of the data from solar energy system providers can be helpful for you to know the output of your targeted system.
Determine Price Savings: If your monthly energy bill is $200, and you are going to reduce this to $80 once you gave your solar panels installed, you are saving $120 each month. This substantial saving can convince the solar investment a lot.
Calculate Breakeven Point: Calculate the break-even point based on the initial investment cost, and the monthly savings. 15,000 system cost, 120 savings/month would take ~ 125 months to break even, or around 10 years
Example Case of Application
Application To Real LifeProblem Consider AExample Of Having A Residential Solar Panel System In Phoenix, Arizona. The household decides an 8 kW system is necessary to cover 70% of their usage.
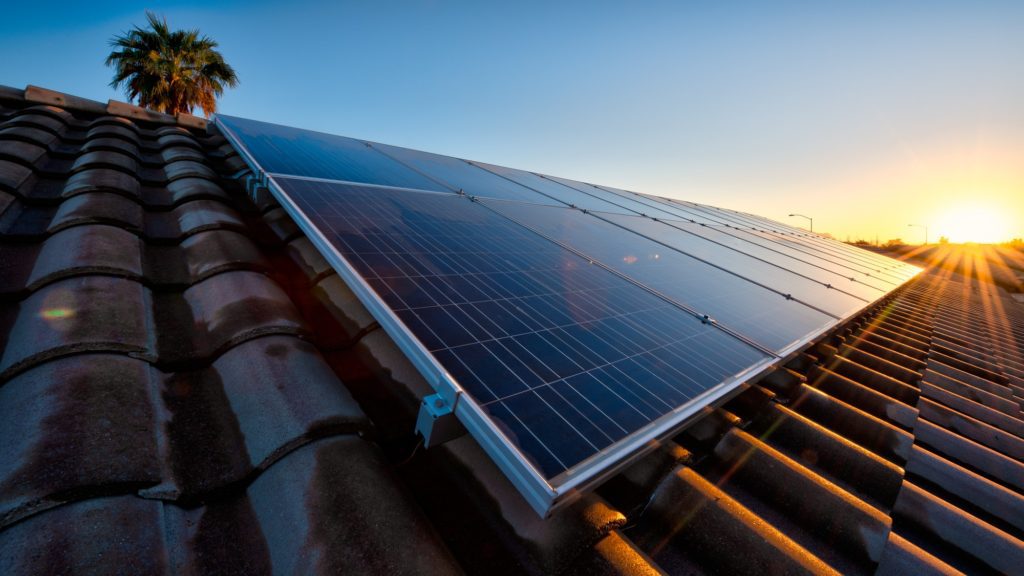
Site Assessment and System Design: A professional visit to the home verifies the roof orientation and angle in regards to material integrity of the roof to determine the most direct access of sunlight. The system has a design of 20 solar panels that are providing 400 watts each.
Installation & Monitoring: connected to a solar monitoring system post-installation to monitor the performance of the system in real-time. The system might generate 40kWh per day during the peak sun hours, which matches well for the energy usage pattern of the household.
Impact on Property Value
Cost effective and value raisingIf you put solar panels in, it not only reduces the cost of your energy bills, but also increases the value of the property. Research has found that homes equipped with solar energy systems have higher resale values than similar homes without them.
Higher Property Value: Research shows that, on average, solar installations increase a home's resale value by just over 4.1%. That is a large sum to help pay down the cost-effectiveness of the project when spread over the course of a year, especially at a $300,000 home value, that could mean up to $12,300 more added by the municipality.

Key Performance Indicators to Monitor
Effective evaluation of solar panel performance requires the monitoring of Key Performance Indicators (KPIs). These measurements offer an accurate view of solar panel efficiency, overall productivity, and wellbeing.
Energy Production
The sum of all of the energy that your solar panels generate is quantified in watt-hours (Wh). It is the most important measure of how well the system is working. For a rough indicator, a 10 kW block of sunlight would be expected to produce 44 kWh right this is in a average sunight area.
Operation and Maintenance — A daily check of daily energy production to the expected energy production forecast. If the output is consistently less than expected it could be the result of factors such as shading, soil, or technical issues.
Performance Ratio
The Performance Ratio plays a key role in evaluating the best of a solar plant. It is the actual energy output of the solar system and the theoretical energy output of an ideal solar system in the ideal condition. This will give a PR of, an ideal system producing 100kWh but the system actually produces 90kWh, the PR will be 90%. PR- A PR less than 80% could point to problems needing attended to.
Capacity Utilization Factor
The efficiency of the total capacity of the solar plant in use is measured by the Capacity Utilization Factor. This is the actual output for a period, divided by the maximum possible output for the same period. A 10 kW plant that makes 88 kWh of output during the day (24 hours) would have a CUF that would be calculated as follows: 88kWh(10kW×24hours)=36.67\frac{88 kWh}{(10 kW \times 24 hours)} = 36.67%(10 kW and if this is produced day and night (24 hours) 88kWh)88kWh=36.67. This tells you how often your system is running full tilt.
Return on Investment
Understanding the financial returns from the solar panel investment vis-à-vis to the initial costs, the Return on Investment (ROI) is calculated
ROI: If the solar system's cost is $20000 and it saves $2000 per year in electricity bill, the ROI can be calculated as 2,00020,000×100=10\frac{2,000}{20,000} \times 100 = 10%20,0002,000×100=10%. This assists in determining the investment's financial efficacy.
Tools for Tracking and Analyzing Solar Output
Assessing the performance of solar panel systems requires dependable monitoring and analytics tools which can track the generated solar output. Such equipment not only offer information in real-time but also assist in predictive maintenance and performance improvement.
Solar Monitoring Systems
What are solar monitoring systems and why are they used to monitor solar panel output in real time? They give insight into how much power was generated, as well as potential issues with the system. Use Case: A solar power monitoring system can send you a notification if suddenly producing less power, potentially due to obstructions like debris or failer of panels. Systems to which conversion is possible, such as with SolarEdge or Enphase, can be tracked to see the amount of power they put out daily, monthly, or annually though a smartphone app.
Data Loggers and Sensors
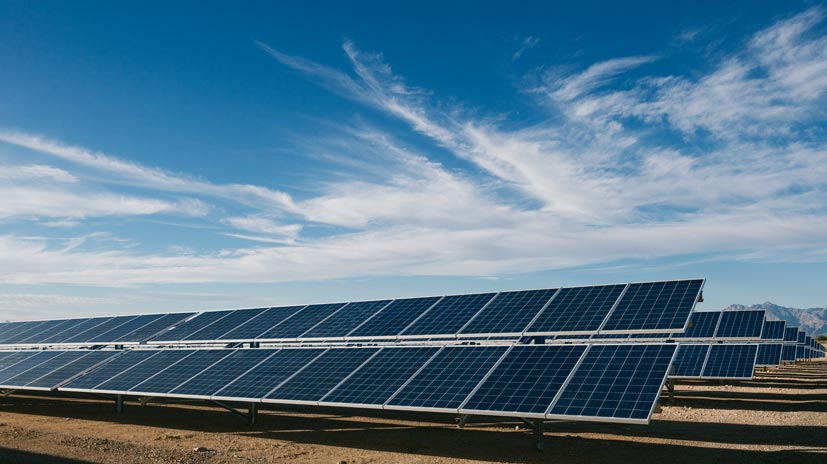
To be implemented along with the solar panel to record multiple environmental and system specific parameters , temperature, sunlight intensity, panel efficiency, etc. data loggers and sensors are installed. Use Case: Sensors in a Nevada solar farm measure energy output every 15 minutes and weather can be correlated to when the output changes. This data helps in panel angle optimization and cleaning schedules to maximize efficiency.
Performance Analysis Software
Data collected from sensors and loggers is analyzed using software tools. These sites have the ability to generate reports that can shed some light on the behavior of solar output, showing trends and patterns. Break Down: PVsyst software can break down the expected solar low due to the weather data of the past and then compare that to the real performance. Which enables you to determine if the system is underperforming, and what might cause the performance issue.
Comparing Mono PERC vs Poly Module Outputs
When comparing solar technologies two important outcomes to consider are how Mono PERC compares against the more standard Poly silicon solar modules. These include varying efficiency, cost, and performance under various conditions.
Efficiency and Performance
Mono PERC cells carry the efficiency because of the Passivated Emitter and Rear Cell (PERC) technology, which makes better light capture and electron retention.
Quantitative analysis: Mono PERC often achieves around 19-22% efficiency, which is higher than poly modules, which often range from 15-17% efficiency. The Mono PERC panels generated 10% more electricity than the Poly panels under similar environmental conditions in a comparative test between two evenly sized installations.
Cost Considerations
Although Mono PERC comes with higher efficiency, it is also more expensive than Poly modules.
Cost Analysis: Noting the above with the same upfront cost (excl BOS) the cost per watt for Mono PERC can be up to ~ $0.05 higher than Poly modules. In case of a 6 kW system, this comes to another $1,500 for upfront investment.
Low light performance
In the mono PERC cell, work is done in better way if we talk about weak signals, if we compare it with help of poly_cells. This is because their more advanced technology that helps to reduce the loss of electron while increasing the ablity to absorb the light.
Practical Example: A Mono set of PERC panels could produce 5% more energy in a month vs using Poly PV on the same geographical place.

Interpreting Data for Better Solar Investment Decisions
An important part of making well-informed solar investment decisions is data — and there is a lot of it. This means tracking the output efficiencies, cost analysis, and long-term performance numbers.
Cost vs. Output Data Analysis
The average person does not realize that investors need to compare the prospective cost of different solar technologies against the prospective output produced over time. Let us think about the situation in which there are two available solar panel models. Model A is $200/panel, 18% efficient and Model B is $180/panel, 16% efficient. Investors can determine which model is more cost-effective, by calculating the cost per percentage point of efficiency.
Utilizing Performance Metrics
The key performance metrics such as CUF, PR etc. are imperative; They provide investors a sense for how often and how much the solar panels will perform at good conditions last. A solar farm in Texas reported a CUF of 25% and a PR of 85%. Those same figures can be used by stakeholders to determine how well the farm is doing in terms of efficiency and operational effectiveness, comparing it to the industry benchmarks to make their judgments about how well they are doing as investors, as well.
Long-Term Yield Projections
These long-term data projections are critical to understanding how solar panels will perform for the life of a project, and thus crucial for the ROI calculation. Data Projection• With historical weather data and current performance metrics, an analysis might project that a certain type of panel will degrade in efficiency by 0.5% per year This would add up to a big impact on the total energy output and financial performance over a 20-year timeframe.


