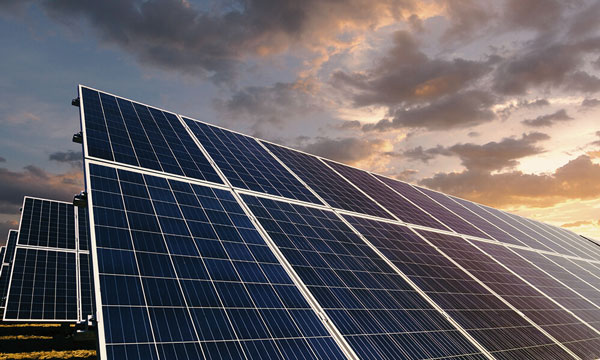
Measure Power Output
How to measure the power output of solar panels depends on efficiency and performance over time. It means taking accurate power measurements using professional-grade tools and analyzing data deeply to determine the output patterns - including what problems may be lurking on it.
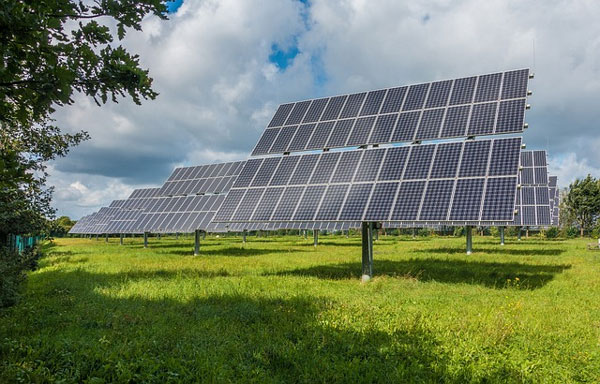
Measurement Equipment
Solar Power Meters and Pyranometers: These are mainly used by technicians to measure the power output from a solar panel. They are necessary to measure the precise amount of electrical power your panels produce in real time. Solar power meters are designed to be directly connected to the output terminals of a solar panel while current and voltage measurements occur in order for it calculate Power (in watts [w] ). These pyranometers are also used to measure the solar irradiance directly at panel's surface, thereby monitoring how much of the amount of sunlight is hitting them [which will allow you to compare what it should generate based on exposure versus really getting out]:
Technical Implementation Of Measurements
Measurement instruments are calibrated and placed appropriately Techs making certain the power meters are calibrated to manufacturer specs, which could affect recorded data in case of incorrect odometer readings. Same for any sensors placed on or near the panels, to prevent from shading/misalignment that could affect readings. Multiple sensors may be distributed across a larger solar panel array to deal with different sunlight exposure levels as the panels themselves are not always oriented correctly or maybe partially shaded.
Data Collection Methodology
Designing the logging of electrical outputs, so that data collection can be automated via relatively simple instruments called ‘data loggers’ as frequently as every 15′ to hourly governmental intervals. Widespread distribution of a PV energy source in the grid leads to high-frequency data collection, capturing daily- and weathers-specific variabilities of power output. Solar panels, for example, will see peak power production at noon on a clear day but may output significantly less during cloudy days or morning and evenings when the sun is lower in the sky.
Detailed Data Analysis
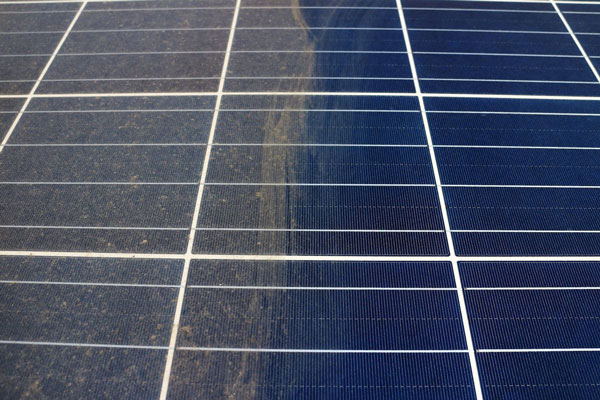
After this data is collected and sorted, it goes through a comprehensive process of analysis in order to display daily as well as seasonal performance trends of power recorded. An analysis produces a power output curve of the device that illustrate peak performance at particular times and show changes precipitated by environmental factors. When examining the Solar and PV panels, technicians seek to verify a peak (ideal condition output) that hits their rated capacity depending on what kind of panel it is. Drastic differences from these normal levels may signal problems with panel performance, decay or other environmental factors such as shading and dirt build-up on the panels.
The Benefits of Being Proactive with Monitoring and Maintenance
It is not just measuring the output that will be of interest over time, but also how long those solar panels are going to last and keep on putting out. This type of data tracking enables predictive maintenance, so that problems such as reduced power output from dust or minor damage can be resolved before it causes a significant efficiency loss. This data-driven, regular maintenance maximizes efficient PV performance and ensures the system continues to operate at its most economically viable.
Calculate Energy Yield
Determining the output of solar panels requires much more complicated number-crunching which considers site-specificities, historical parameters and trends in using performance ratios along with what you want to achieve from installing a PV system. This process will ensure that solar panels are maximized to meet the energy needs tailored by scenario.
Scenario-Based Calculations
Do explore how Solar Energy Savings is calculated as it depends on the current use-case of a roof to be accurate. Calculations for such systems are usually aimed only at meeting daily energy consumption - billed as net metering - or matching the time of use of one's electricity demand to when a solar system is generating, also known as on-grid or connected behind-the-meter. Commercial installations, however will need specific hourly breakdowns of production to coincide with operational hours and increased power demands. An example would be a commercial solar system; this will also need to manage peak times and use solutions such as battery storage to balance supply with demand.
Long-Term Data Analysis
In solar panels, it is paramount to take the long term production data for consideration when making a reliability and efficiency analysis. This may even involve taking data during different seasons and weather conditions to get a sense how much solar output could be reduced by outside factors. Owners and analysts can monitor production fluctuations (regional or general) using a data loggers linked to the solar array. This unbroken data is like gold dust in predicting future performance and being able to schedule maintenance or upgrades.
Benchmarking and Performance Comparison
Performance assessment, when comparing with the similar systems is crucial to understand that solar panels are functioning well. This is typically done with actual output data compared to some predicted value based upon the solar panel specs and measured irradiance at the location. One of the most crucial metrics considered in this analysis are Performance ratios that provide an insight into how effectively solar panels operate by measuring to what extent actual performance compares with theoretical maximum. Performance Ratio 75% to 85%, for high performing Panels.
Prequent Calculations Tailored To Your Situation
Calculations should be unique for the specific energy requirement. In some cases, such as locations with erratic sunshine it may be necessary to plot the estimated yield more accurately in order to optimize supplementary energy sources accordingly (e.g. grid connection or generator). Also, with systems aimed at energy-heavy tasks - such as powering heavy machinery or charging EV batteries - the equations might include factors like peak demand charges and time-of-use rates to extract maximum cost savings.
Utilizing Software Tools
Software tools today can help greatly in calculating the solar energy harvest. Built with 20 years of historical weather data, real-time sunlight exposure and system specifics; these tools output accurate and predictive performance metrics. These could run different scenarios or visualize what the performance in time of the solar panels will be. The digital nature of this approach further allows fine tuning changes to system settings, predictive maintenance schedules and improved energy management strategies.
Evaluate Performance Ratios
How EVs Can Make Charging The Grid Easier: Surplus Solar Power Charge Batteries-Fill Up Cars Evaluating the performance ratios (PR) is crucial for understanding how efficient and durable solar panels are. This procedure includes determining the division of factually electricity being produced from those solar panels by way they would produce under each idealistic environment, it is a straightforward method to determine system performance.
Performance Ratios Explained
These ratios provde a quantitative way to assess how well your solar panel system is performing by directly comparing the energy that you are getting from it with what would be possible if you had full sun all of the time. Where the actual measured output (usually kilowatt hours, kWh) is divided by what was expected based on a standard calculation from the panel rating and amount of solar energy coming in over that period. A PR over 100% will indicate the panels are performing at their expected output and anything lower may show inefficiencies with the system.
Catching Data for PR Calculation
To streamline the accurate PR calculations - data collection should be easy and uniform across all instances. This includes the use of many tools:
- Solar irradiance sensors, on the other hand measure the power per unit area received from the sun in form of electromagnetic radiation.
- The panels are each attached to a electricity meter which records the true energy output. For good fariable results, these items must be appropriately and regularly calibrated. It is important that the data collected from these devices be synchronized to have it correspond with compatible time intervals as to prevent comparing across dissimilar measurements.
Detailed Calculation Process
Power Ratio (PR) is assessed by measurements of real energy production as generated for a given interval, like daily or monthly. At the same time, you also have solar irradiance sensors that give data to panels about how much light and therefore energy is available from these panels. This is used in conjunction with the total irradiance and rated capacity of a panel to generate an estimate of their theoretical maximum energy output. In the case a panel rated 300 watts panels receives sunlight equivalent to 4 hours of peak energy per day (a potential for about 1,200 watt-hours or rather: 1.2 kWh), and it only turns into an electrical output equaling just one kilowatt-hour (kWh) in value, so PR would be calculated thusly: =(1 /.12 ) *100% =83.33%.
Significance of Monitoring PR
The reasons why we need to continuously monitor them are as follows:
- It is used to detect significant underperformance, or degradation of panels which visual inspection and regular maintenance checks will not indicate.
- It gives an idea of how the shading, dust and weather will affect your solar panel productivity.
- In addition, proving that the performance guarantees provided by panel manufacturers or installers are correct.
Initially, a database of performance ratios can be maintained over the lifetime of an installation to track trends in efficiency and potentially predict failures or maintenance needs. This preventative form of maintenance can add years to the life expectancy and ROI of solar energy investments.
Perform Flash Tests
Flash testing is a critical aspect of quality assurance for photovoltaic (PV) panels, providing exact data on the performance characteristics of a panel under sunlight conditions that are simulated. This test ensures each solar panel meets the demanding efficiency and output requirements for optimal performance.
Flash Testing Equipment and Setup
Flash testing begins with a setup that includes an instrument known as the solar simulator - essentially, a very pretty piece of kit designed to throw controlled pulses or "flashes" of light at your subject site(condition). It is an artificial sun simulator with xenon or LED light sources that are able to deliver and maintain a steady irradiance comparable to the natural sunlight. This simulator houses the panel, with its side back-silvered by design that scatter free light uniformly all over it.
Detailed Measurement Process
- 24. 37Initial Calibtation: The solar simulator is calibrated with each testing by using an reference panel with known characteristics. It helps in providing test the correct light intensity and spectrum delivered.
- Mounting of the Panel: The PV panel to be tested should fix at test region in simulator. Accurate alignment is necessary to ensure the light reaches the plate evenly and at right angles.
- Faking Sunlight: The simulator produces a brief, intense flash of light, which usually lasts only microseconds. One sun (1000 W/m²)): typical sunlight condition on a clear day at noonThis is the standard test conditions defined by current solar hackers, so if your panel carries this sticker you can believe it; or not..
- Data Capture: When the flash of this panel is displayed, they have to get their response on record instantly. The key measured parameters include:
- Voc- Open-Circuit Voltage: The highest possible voltage produced by the panel without any load on it.
- Isc (Short-Circuit Current): The largest current that will flow if the terminals of your panel are shorted.
- Maximum Power Point (MPP): The combination of current and voltage that produces the max output power from the panel.
- Others metrics: Finally, advanced simulators can also record fill factor and panel efficiency to name but a few. They are acquired nearly instantaneously, to show how the panel is doing during a peak sunshine moment.
Analysis of Test Results
The collected data is analyzed to assess the panel's performance after a flash test. In this case these are wich we compare with the values to be measured and given in thr manufactorers specifications. A deviation from expected performance can be a great indicator of possible issues or weaknesses in the panel. Any panels that do not meet the necessary standards are either sent back for re-manufacture or broken down and disposed of, guaranteeing only top-quality products make it to market.
Perform Field Tests
The importance of field testing solar cells cannot be overstated: far too often, panels perform very differently in the real world than they do under controlled laboratory conditions. These types of tests provide a comprehensive evaluation on the performance life of solar panels with different environmental and climatic conditions.
Setting Up Field Test Sites
Field testing To do effective field tests, the solar panels must be installed in multiple locations that represent different geographical and climatic zones. These may be arid deserts, humid tropical locations and cold territories to include a range of environmental states. Every launchpad is fitted with advanced monitoring - Performance Meters and Environment Sensors, a necessity to collect accurate real-time data. Such installations often imitate common residential, commercial or industrial solar deployments to provide results applicable to predicted end use cases.
Visibility on Real World Performance
Validation of test installations Once functional, these research set-ups are monitored continuously during long periods (several months to more than a year). And this period is important to correctly observe seasonal influence as well, which affects the output of a solar panel. Daily and cumulative electricity generation, instantaneous power output and overall efficiency are some of the key numbers technician check on a regular basis apart from engineers.
Data Collection Techniques
Field test datalogging is extensive and often running throughout the course of a project - using data loggers capable of accepting multi-channel inputs from different sensors. It has sensors as well but this time to not only measure the output of solar panels, it also checks for other environmental parameters including irradiance (amount of direct sunlight shine), temperature outside, wind speed and rain. Telemetry systems used to transmit the data back in real time which arrive at a central monitoring facility where further analyses and response are performed immediately if any problems got detected.
Performance Model Tuning and Variation Analysis
The data is collected and further analyzed to help determine the impact of various factors on solar panel performance. They find environmental relationships based on this data and compare sample forecasts with panel outputs. Then they might research questioning if high temperatures affect the panels' efficiency or, according to winter months finding out how performance is reduced by low light situations.
Analyze Degradation Rates
To keep solar panels efficient over a long time, however, it is important to know the degradation rates of your own and every photovoltaic system in detail. This requires detailed monitoring and study of the degradation changes in performance that occur with exposure to environmental conditions, and also on material ageing effects.
Creating a Benchmark for Performance
The most effective way to assess degradation rates is by setting a clear performance level baseline for that particular array of panels as soon as you can after the solar panel set was installed. Typically this initial data is obtained by performing accurate flash tests that record the maximum power, voltage and current under known conditions. This baseline will set a new standard of what to expect from the panels' collection in all future comparisons, and help you see how they perform over time.
Continuous Monitoring of Performance
This continuous monitoring includes the design criteria is logged during periodic milestones in the lifetime of solar panels. A monitoring system with attached sensors and data loggers is posted to record the output of panel at a regular basis. The data contains power production on a daily basis and the voltage levels, current which is very important to see how healthy your solar panels are running hence this kind of monitoring made my life easier than expected.
As an example, we may track output at intervals showing a development of 300 watts (W) from the panel then record how this changes across various weather conditions and as it ages. Such trends can only be identified using information collected over the long term.
Data Analysis Techniques
Normally, the degradation rate is determined through standard statistical techniques that compare annual data performance with respect to a baseline. Analysts may either plot tried and tested points, in which case they track trends to calculate the compound annual percentage efficiency decrease.
As an example, if the panel output of 300 watts falls to a maximum power rating of 295 watts one year later would lead toward a degradation rate around year depletion approximately 1.67%. This calculation is performed yearly to determine if the rate of degradation continues, accelerates or whether there are any outliers.
Effects of the Environment
Almost half of the degradation rates are influenced by environmental factors. Warmer ambient and solar irradiation conditions or more frequent freeze-thaw-cycles are resulting in further degrading of the panels. Researchers frequently employ geographic and climatic data to scale their models and provide context for the solar panel system effect at a local level.
For instance, panels in a desert climate could degrade more rapidly for high UV exposure and temperature fluctuation over those located in warmer climates. Through the comparison of panels across varying environments, analysts can more accurately estimate performance in given conditions.