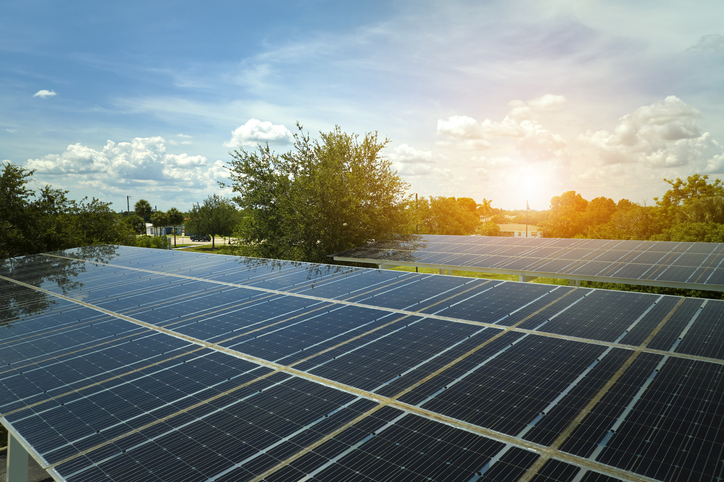
To calculate potential solar output, assess sunlight exposure, analyze roof orientation, select efficient panels, consider shading, and use a solar calculator for precise estimates
Assess Geographic Location
The second is to take into account the installation geolocation to make an accurate modelling of the potential solar output. This is an important early step, as it helps the store evaluate its basic solar energy production potential, as determined by regional solar irradiance and weather.Collecting Solar Irradiance
There is significant geographic variability in Solar irradiance. According to data from the Solar Energy Industries Association (SEIA), states such as Arizona and Nevada can boast over 5.5 peak sun hours per day, marking them as ideal prospects for solar installation. For example, Washington and Oregon tend to see more clouds, with an average of 3 to 3.5 peak sun hours. This data is necessary in order to correctly estimate the maximum amount of solar energy that can be captured at a given location.Observation of historic weather data
Solar planning involves a great deal of historical weather date, which largely determines the number of sunny, partly cloudy and overcast days. The information is available from national weather services, or local met offices. They have some of the highest solar potential, as they receive 280 days of sunshine or more annually, versus some parts of New England that can have less than 200 days of sunshine each year.Local Regulations and Incentives
As well, local incentives and solar regulations help direct solar panels to the right place. Other areas provide better incentives, PWM discounts or feed-in tariffs, which makes the solar investment more enticing even though sunshine is low. Depending on where the project was located, some of the incentive information could be dated and inaccurate, which could significantly change the overall feasibility and design of the solar system for the project.Using Geographic Information Systems (GIS) Tools
Advanced GIS tools and solar mapping technologies yield specific solar potential information for a region The data from these tools can evaluate topography, the amount of shading from surrounding buildings and other objects, and the perfect angle at which the sun will greet the surface, giving a near-perfect assessment of the solar potential for a specific location.
Determine Optimal Panel Location
The placement of solar panels is crucial for solar energy production and the amount of electricity you can produce. Encompassing the above elements, this phenomenon encompasses several important steps that consider physical as well as environmental conditionsEvaluate Roof Orientation
Efficiency of these panels is highly dependent on the direction of the solar panel towards the sunlight. In the Northern Hemisphere you want your solar panels to face true south for the best sun exposure. According to the U.S. Department of Energy, in fact, panels oriented south can enhance energy output by as much as 20% when compared to east and west placements.Assess Roof Slope
The angle or pitch of the roof is also another factor of how well solar panels work. Usually the best angle is your latitude in order to catch the most sun over the course of the year. In other words, a roof slope of 40 should be a location with a latitude of 40 degrees. Because solar gain penalizes you only during cooler months, mainly in the winter when the sun rides lowest in the sky, and orients the most windows to south, where most of your passive gains come from due to its ability to turn your walls into small absorbents and turn your interior into a beautiful heat sink.Consider Potential Shading
Solar panels are rendered less effective when they experience anything less than full sunlight, and trees or buildings can cause shading issues that reduce efficiency. You want to consider shades at various times of the day and season. Resources like the Solar Pathfinder or online programs such as Project Sunroof by Google can show shading patterns and best unshaded locations for panel placement.solar design software
Delivering rich insight on this front is solar mapping software, which allows for an in-depth look at geographic and architectural details. These tools typical examine the available square footage, roof facing and obstructions to illustrate the most efficient location for solar panels. e.g. creating annual sun exposure using LiDAR data and mapping nearby structures to understand impacts of neighbors on solar potential.Calculate Solar Panel Efficiency
To estimate the solar output accurately, we need to be able to understand and calculate the efficiency of solar panels. This process includes examining the kind of solar panel, how it operates for a variety of light conditions, and its total percentage of efficacy conversion.
Maxeon Solar Type
There are different types of solar panels available, essentially monocrystalline, polycrystalline and thin-film running head to head in the market. There is an efficiency number assigned to each which varies from style. More characteristic of solar power, monocrystalline panels are identifiable by their uniform dark color and rounded edges and usually have the highest efficiency rates of 15%-20% or so. Classified morphologically, polycrystalline plates typically range between 13% and 16% (with a slightly less uniform blue hue). Thin-film), on the other hand, while more flexible and lower in profile, are generally less efficient (about 10% to 13% for the leading products).
Know the correlation Of Temperature
Increased temperatures reduce the efficiency of solar panels. Research has revealed that monocrystalline and polycrystalline solar panels suffer a reduction in output by about 0.5% for every 1°C increase in temperature beyond this point (25°C, 77°F). A rooftop generating 45°C could experience a reduced efficiency of up to 10% on just the panels.
Evaluate the Absorption of Light
The efficiency of a solar panel is related to how much light the solar panel can absorb. Light absorption is improved with innovations such as anti-reflective coatings and textured surfaces. The manufacturers usually saying to what percentage of light is absorbed that is 90% and more than this like in high-end models.
Theoretical Maximum Efficiency Calculation
The material and construction of the solar module are what determine the maximum percentage of sunlight energy that can be converted. In the case of a single-junction solar cell (like silicon) we cannot expect more than about 33% efficient (this is the Shockley-Queisser limit), and even that is rather optimistic, as practical real-world considerations (wiring, shading, etc) will seriously reduce that efficiency.
Performance in the context of the Real World
Field performance really IS different from lab conditions. Efficiency is affected by factors like installation angle, geographic location, and upkeep. Actual efficiencies that are seen in the real world — like actual data from operational solar farms. Here, large scale solar installations in Nevada have on average much closer to the higher end of their panel's efficiency range due to ideal placement and maintenance, to give but one example.
Consider Weather and Seasonal Variations
Considering variability in weather and season is key to accurately estimating how well a solar panel system might perform. This is done to pass real world conditions that will have an effect on how much solar output ends up in the solar outputting calculations.
Impact of Cloud Coverage
How cloudiness affects its cloudiness is its most alarming output in terms of the performance of solar panels. For example, data from the National Renewable Energy Laboratory (NREL) indicates that a solar panel may only produce 60% of the energy that a similar installation in sunny Southern California might at a location in Seattle – which itself is not as cloudy a locale as many believe! Our analyses work in combination with local weather predictions to maximize the amount energy production predicted with the available system capacity.
Seasonal Sunlight Variation
The amount of solar output not only varies daily, but also seasonally. The sun is lower in the sky during the winter months so the days are not only shorter, but also receive diminished sunlight. This reduces the output power of solarADING In Boston, for instance, solar panels generate ~30% less energy in December compared with July, which is due to differences in sun exposure (when we discuss peak solar hours, full sun 4-7 hours and partially sunny 2-4).
Solar Efficiency and its Comparison to Temperature
Although counterintuitive at first, solar panels actually work less efficiently at higher temperatures. As my colleague Nick Lavars reported, a study reveals that for every 1°C over 25°C (77°F), panel efficiency drops by about 0.5%. This might be crucial in hot regions like Atizona where temperatures in their summer can surpass 40°C (104F), where some cooling strats or panel with better high-temperature performance are a must.
Dealing with Snow and Ice
In warm weather this is rare, but in cold climates, a layer of snow or even a thick frost can form over panels and obscure the sun, reducing output for a short time. Panels are generally mounted at an angle, which can let snow easily slide off once the sun emerges. Places where heavy snow in winter are more common may need more infrastructure to keep the panels clear and in full winter trim.
Adjusting for Wind and Agitation
Solar generation can also be temporarily reduced by wind and storms, with wind responsible for the ongoing risk that those high panels could be damaged by a bit of flying debris. For coastal hurricane-prone regions for example the state of Florida, the solar panels installed need to sustain strong wind speeds and security precautions must be taken to secure the installation.
Review Energy Consumption and Savings
Has an accurate analysis of current energy consumption and predictions for future electricity savings from a solar installation ( this must be included to forecast potential solar production). Both of these programs equip the homeowners and businesses to precisely determine the financial benefits and assistance in the customization of the solar system according to the respective energy needs.
Audit Current Energy Usage
There are several stages in the process and the number of optional extras can be bewildering but the initial starting point is to carry out a full audit of current energy consumption. It goes back through old electricity bills to get an idea of average use. The typical American household uses approximately 877 kWh per month, but that figure can fluctuate dramatically depending on the home size and usage habits. This is used to design a system that provides enough output.
Solar Power Production Prediction
Estimate the proposed solar system energy production based on available data on latitude, solar cell potential, and environment. It is ist auch possible to use tools such as the PVWatts Calculator by NREL, in which you type in variables and receive an estimate of how much electricity the system would produce over the course of a year.
Calculate Potential Savings
This should give you a good idea of how much you might be able to save by offsetting your current bill by replacing the electricity you're using now with electricity your solar panels are projected to produce. In California, for instance, if a home pays the average residential rate of $0.20 per kWh, and they are capable of generating 800 kWh of solar electricity a month, the savings could be about $160 each month.
Account for Incentive Payments and Rebates
Add federal, state and local solar incentives in the savings calculation to present a more viable budget analysis. The Investment Tax Credit (ITC), for example, enables a 26% deduction on the cost of a solar energy system from the total federal tax bill, an effect that can reduce overall costs and payback periods.
Analyze Financial Fallout Over the Long-Term
Look at the costs over the years to determine long-term savings and consider the maintenance, lifespans, and if the system will end up adding value to the home. According to studies, solar installations continue to increase property values compared to homes without solar panels by as much as 4.1%.